LuaProfiler
LuaProfiler is a powerful tool for tracing function calls, measuring execution time, memory usage, and garbage collection activity within your Lua environment.
Installation
Manual Installation Only
- Download this zip: LuaProfiler-1.5.0.0.zip
- Unpack the
.zipinto yourInterface/AddOnsdirectory and restart the game.
Note: read more on this old website LuaProfiler.html
Usage
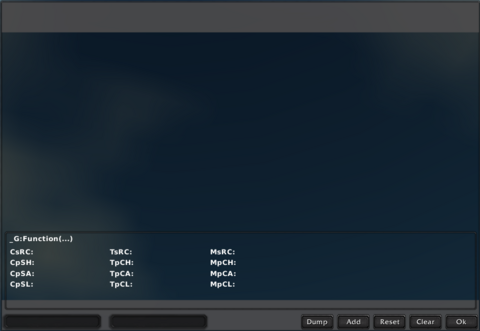
Opening the Profiler Window
Use the slash command /profiler or /prof to toggle the profiler interface.
Setting Up a Trace
- Enter the scope pattern (e.g.,
"MyAddon"or"CoolDown"). Leave empty to trace global functions. - Enter the function pattern (e.g.,
"_OnUpdate"). - Click Add to hook functions matching the patterns. It may take some time depending on the number of functions.
Managing Data
- Click a trace line to view detailed stats in the info panel.
- Hold SHIFT while clicking a line to unhook the function.
- Hold CONTROL while clicking to reset trace data for that function.
Refresh & Sorting
- Click on any column header to sort data by that metric.
- The view updates when clicking column headers or manually refreshing.
Reset & Clear
- Reset: Clears statistics without unhooking functions.
- Clear: Unhooks all traced functions.
Dump Data
Press Dump to export all traced function stats into your SavedVariables for offline analysis.
Commands
| Command | Description |
|---|---|
/profiler or /prof
|
Opens/closes the LuaProfiler window |
Preview
Notes
- Linux/Wine: Edit
LuaProfiler.luaat the top, setLINUX_HACKto1000000for accurate timing under Wine. - Windows: Ensure
LINUX_HACKis set to1.
Example Use Cases
- To trace Blizzard's
OnUpdatefunctions, set the function pattern to"_OnUpdate". - For object-oriented addons, enter the class name in the scope pattern (e.g.,
"coolDown"). - To trace the profiler itself, set scope to
"LuaProfiler".
Data Columns
Each column label encodes data type:
| Label | Meaning |
|---|---|
| C | Calls |
| T | Time |
| M | Memory |
| G | Garbage Collections |
Followed by:
- pC: per Call
- pS: per Second
- sR: since last Reset
And sub-types:
- H: High
- A: Average
- L: Low
Examples:
- CsRC = Calls since (last) Reset (the last 'C' means nothing, yet)
- TpCA = Time per Call Average - Average time per call spend in the functions
- MpCH = Memory per Call High - the highest amount of memory allocated by one call.
- GsRC = Garbage collections since (last) Reset
Dump Data Format
Press Dump to save current stats. The data can be analyzed with a Lua script like:<syntaxhighlight lang="lua"> dofile("LuaProfiler.lua") for dumpIndex, dumpTable in LuaProfilerDumps do
   print("Inspecting dump #"..dumpIndex)
   for _, traceInfo in dumpTable do
       print("Function \""..traceInfo.functionName.."\" has been executed "..traceInfo.stat["CsRC"].." times")
   end
end </syntaxhighlight>
Change
1.5.0.0
- Added 'Dump' button to dump the stats to the SavedVariables.
1.4.0.0
- Reworked interface
- Much more statictical data shown
1.3.0.0
- Now also displaying:
- Memory usage (in kbytes)
- How many times the GC was triggered.
1.2.0.0
- Fixed typo in function argument list
1.1.0.0
- Now shows usage for all traced function right of the input fields
